The Wall Street Journal created a pretty cool interactive graphic showing how the gender pay gap varies by profession (well the graph is cool...the phenomenon is not).
Check it out! Use this your lectures on the pay gap
http://graphics.wsj.com/gender-pay-gap/
Showing posts with label Interactive Graphic. Show all posts
Tuesday, August 16, 2016
Voting Habits [interactive graphic]
The Upshot at the NY Times put together a graphic that shows voting rates of different groups.
The big interactive graph is a little busy when all of the data are together but users can narrow down by certain categories which can help you make comparisons between groups. You can see what percentage of the group voted in 2012 but also who they voted for. If that seems like too much information, try using some of the smaller graphs to make your point.
Interactive Graph: http://www.nytimes.com/interactive/2016/06/10/upshot/voting-habits.html
Various Smaller Graphs: http://www.nytimes.com/interactive/2016/06/10/upshot/voting-habits-turnout-partisanship.html?_r=0
Gender in the Movies
The website polygraph looked into the issue of gender equality and film. Here's how they describe their methods: "We Googled our way to 8,000 screenplays and matched each character’s lines to an actor. From there, we compiled the number of words spoken by male and female characters across roughly 2,000 films": Link to the data here: http://polygraph.cool/films/
The authors use the example of Disney films (Image Below). The site also featured in interactive graph, you can look at 2,000 of the screenplays, search for a specific movie title, and look at the difference in gender dialogue breakdown by genre.
The interactive features make this a great tool to use in class. You can also push your students to discuss the quality of the methods.
Income Distribution of Various Jobs [Interactive Graphic]
Flowing Data used IPUMS data to look at how the salaries of different classes of occupations were spread out over time.
http://flowingdata.com/2016/06/28/distributions-of-annual-income/
One of the most interesting trends is to watch how the salaries changed after the 80s. In most occupations, you can see that a few top jobs were making bank, while most other professions stayed the same.
Gun Deaths in America
When teaching about gun violence, it is helpful to have data. It's even more helpful to have that data visualized.
fivethirtyeight put together an impressive visualization: http://fivethirtyeight.com/features/gun-deaths/
In this series of images, each square represents one death. The images will allow students to see how the gun deaths that dominate our conversations (mass shootings, violence by and against police, and terrorism) are minimal compared to suicides and homicides. The charts also show how this gun violence is connected with gender, age, and race.
Once you scroll through the data, you can explore it on your own using filters.
To compare the US to other countries, check out this data put together by the Upshot: http://www.nytimes.com/2016/06/14/upshot/compare-these-gun-death-rates-the-us-is-in-a-different-world.html?_r=0
Cash Welfare in the United States
This summer Marketplace put out a great podcast mini series on cash welfare in the United States. Not only was the series informative, the accompanying website contained informative info graphics that would be useful in classes.
http://features.marketplace.org/yourstateonwelfare/
When you visit the site, scroll down to the bottom of the page to locate data on your own state. A sample graph is below.
It would be great to pair this with readings by some of the sociologists featured in the audio series, such Kathryn Edin or Tressie McMillan Cottom.
Friday, August 12, 2016
American Views on Race [interactive Graphic]
The Pew Center published results from their national survey on race relations.
http://www.pewsocialtrends.org/interactives/state-of-race-in-america/
The interactive graphics are a great way to show students how divided Americans feel about these issues. I find this is especially helpful in places where the majority of students come from similar backgrounds > it opens them up to the possibility that not everyone shares their experiences or attitudes about the topic.
The study also looks at certain questions over time which allows students to see the idea of backlash.
Sunday, February 28, 2016
Power and Race [Interactive Graphic]
In response to the recent critiques about racial representation in the Oscars, The NY Times recently put together a graphic showing the "Faces of American Power". The times include powerful people in entertainment, but also looked at leaders in other fields such as business, politics, and sports.
The result is a powerful representation of just how white our power structure is. You may even want to point out colorism--those leaders who are included as minorities are often very light-skinned. (Think Marco Rubio or Cory Booker). And finally, wile it wasn't the focus on the analysis, this visual can also show your students just how white and MALE the power structure is.

I often display charts showing how many CEOs or Senators are white, but I think for some students, images work better than numbers can to illustrate the depth and breadth of the issue. I hope you can use this to help students see the concept of white privilege and power. Here's the link:
http://www.nytimes.com/interactive/2016/02/26/us/race-of-american-power.html?_r=0
The result is a powerful representation of just how white our power structure is. You may even want to point out colorism--those leaders who are included as minorities are often very light-skinned. (Think Marco Rubio or Cory Booker). And finally, wile it wasn't the focus on the analysis, this visual can also show your students just how white and MALE the power structure is.
I often display charts showing how many CEOs or Senators are white, but I think for some students, images work better than numbers can to illustrate the depth and breadth of the issue. I hope you can use this to help students see the concept of white privilege and power. Here's the link:
http://www.nytimes.com/interactive/2016/02/26/us/race-of-american-power.html?_r=0
Tuesday, February 2, 2016
Birth Year & Political Views [Interactive Graphic]
Whenever an election is grabbing media attention, student interest peaks. I often talk to students about how social statuses can influence who votes and what types of choices they make. The graphic makes a nice starting point when talking about this and can also be used in a methods class.
The NY Times produced this interactive graphic about age and voting. It clearly shows the cohort effect as well as the tendency to grow more conservative with age.
http://www.nytimes.com/interactive/2014/07/08/upshot/how-the-year-you-were-born-influences-your-politics.html
The current graphic is only for whites > I hope they are able to look at other groups in the future.
Tuesday, November 17, 2015
People Killed By Police [Interactive Graphic]
When I talk to students about police brutality, I usually get several students who express anger that the media talk about police who harm black people more than they talk about police who harm whites. These students will are upset that these white victims are not getting justice. As someone who has studied race and justice, I know that the victims are disproportionately black, but the students don't always understand this. But that's why they are in our classes, right?
So I thought it would be helpful for them to see actual data on the issue. I found this interactive database compiled by the guardian. According to the website, "The database will combine Guardian reporting with verified crowdsourced information to build a more comprehensive record of such fatalities"

I displayed it in class and clicked around on the site to show students a little about the data.
http://www.theguardian.com/us-news/ng-interactive/2015/jun/01/the-counted-police-killings-us-database#
Please keep in mind that these victims represent a variety of types of death (motor vehicle fatalities, deaths in custody, shooting, etc). You can use the filters to sort by a number of variables. You can also view the data as a list or on map.
Here are some interesting things that I found and shared with the students. Use the database to create your own list of points to share.[ As of today's writing, there were 1000 people killed, so I'll be working with that number. It also makes the math super easy!]
- I started by confirming students' view that the majority of people that were killed by police were in fact white. However, I then toggled back and forth between "total" and "per million".Since whites make up more of the total population, they also make up more of the victims (502 Victims). But blacks are more likely to be killed respective to the numbers of blacks in the population. There were 250 black victims but that means 5.94 blacks were killed for every million blacks in the population. The respective numbers for white victims is 2.54.
- 198 of the victims were unarmed, or 19.8% That is important because it shows 4 out of 5 times, the victims represent threats to police and to others. So here, I like to point out to students that police are doing their jobs well in most situations.
- Furthermore, only 88 of those unarmed victims were killed by gunshot.(For example, many of the unarmed victims died in motor vehicle accidents) That's only 8.8%.of all deaths.
- So what happens when we look at these 88 deaths? 35 of those victims were white and 31 were black. That means that 6.9% of all white deaths were unarmed victims shot by police and 12.4% of all black deaths were unarmed victims shot by the police. I think this comparison indicates a clear racial disparity that you can talk about with your class.
It may be helpful to go through these same steps above, but using the current numbers. Your class can all calculate the numbers together, which helps students see that you didn't just "make up the numbers to distort the issue"
Money in Politics [Interactive Graphic]
When I talk about inequality and power with student, we often discuss the role of money in politics. It can be hard for students to grasp exactly how much money we are talking about but I think this interactive graphic from Slate magazine can help students visualize the issue.
http://www.slate.com/articles/news_and_politics/politics/2015/11/super_pac_money_how_political_groups_are_spending_to_influence_the_2016.html
Check it out!
http://www.slate.com/articles/news_and_politics/politics/2015/11/super_pac_money_how_political_groups_are_spending_to_influence_the_2016.html
Check it out!
Thursday, April 30, 2015
"The Real Stuff White People Like" Talking About Race, Ethnicity, & Relationships [Interactive Data]
Today in class, my students and I were talking about race, ethnicity, friendships, and dating. Our discussion centered on how cultural norms in different communities could influence people's likes and dislikes. Because we look for friends and romantic partners who share out interests, these likes and dislikes can affect who we choose to form relationships with it.
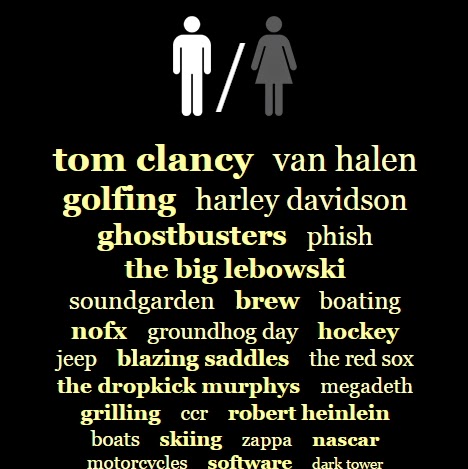
In order to get the students involved in talking about this without feeling like they were stereotyping people, I showed them some data collected by the fine folks at OKCupid. The OKCupid staff looked at unique words and phrases used in the dating profiles of their site users and created interactive graphics showing the results.
The students got a kick out of this activity and it definitely broke the ice. After I showed them these examples, we had some great conversations about we find friends and dating partners and how/why these things matter to their lives.
Link to the site: http://blog.okcupid.com/index.php/the-real-stuff-white-people-like/
Tuesday, March 17, 2015
Map of Social Inequality using Human Development Indicators [Interactive Graphic]
How does the United States rank on measures of health,
education, gender inequality, poverty, and other human development indicators in
comparison to other countries around the world?
Use this interactive map and data from the United Nations Development
Programme to help students get a better grasp on the “big picture” of social
inequalities.
Tuesday, March 10, 2015
Gender and Teaching Evaluations [Interactive Graphic]
As sociologists, we know that people are evaluated differently based on their gender, but it can be hard for students to visualize this out of context. This tool allows them to visualize gender and evaluations in a very relevant way: through professor ratings. Ben Schmidt looked at the evaluative words used in Rate My Professor reviews and compiled the results in this series of interactive charts.
You can search for any word. The resulting graph will show you the difference between male and female professors in a variety of disciplines. You can see one example above. According to evaluations, men are funnier than women are more likely to be labeled as "genuises". Males are also more likely to be rated as intelligent and smart (though the gaps are smaller). . Males were also more likely to be "weird" in every discipline other than Physics. Females were always more likely than males to be rated as "nice" and to be rated as "mean".
Thanks to Dr. Schmidt, assistant history professor at Northeastern University, for putting together this data visualization.
Link: http://benschmidt.org/profGender/#
Tuesday, December 9, 2014
Parable of the Polygons [Interactive Activity]
A big shout out to Dr. Steve Chapman for sharing this one with me. This activity would be very useful for teaching your students about residential segregation.
The 'Parable of the Polygons' is an interactive online activity put together by Vi Hart and Nicki Case It is based on the game theorist Thomas Schelling's segregation simulator.
The interactive graphic allows students to move the shapes around until they are 'happy'. You can change how much diversity the shapes started with and how much they demand. These changes show some interesting results!
Link: http://ncase.me/polygons/
Hart and Case sum up by reminding students that small individual decisions often result in a much larger collective outcomes, that the past has bearing on the present, and that demanding diversity is important. These are great points; however, I would also recommend pairing this activity with some sociological readings on residential segregation in housing.
Friday, October 31, 2014
Laws re: sexuality and gender identity in the U.S., by state [Interactive Graphic]
This interactive graphic allows students to explore legal policies that impact gay, lesbian, and transgender people by state and region in the United States. Issues covered include marriage, hospital visitation, adoption, employment, housing, hate crimes, and education.
Link: http://www.theguardian.com/world/interactive/2012/may/08/gay-rights-united-states?CMP=twt_gu
Tuesday, October 21, 2014
The Widening Wealth Gap [Interactive Graphic]
The Washington Post published this interactive graphic examining net household worth by RACE and EDUCATION. The data are pulled from the US Census Bureau Survey of Income and Program Participation.
For each graph, you can click on a Census race category to see the differences in wealth. The bars will grow and shrink as you click. A second graph performs a similar function using educational categories.
Check out the site here: http://www.washingtonpost.com/blogs/wonkblog/wp/2014/08/22/the-state-of-americas-widening-wealth-gap/
Friday, September 26, 2014
Gender Gaps in PhDs [Interactive Graphic]
Scientific American recently published an article on the PhD gender gap. The article included an interactive feature where students can look at the gender difference in PhD by country (56 nations are included) and also by subject area. If you plan to talk about the underepresentation of women in certain subject areas OR if you plan to talk about global differences in gender roles, this tool should help your students visualize the differences.
(Link here: http://www.scientificamerican.com/article/how-nations-fare-in-phds-by-sex-interactive/)
Friday, September 12, 2014
Is Going to College Worth It? [Interactive Tool]
Thanks the NPR's Here & Now for bringing this interesting interactive tool to my attention. The tool called, Take the Plunge, was designed by Fusion. Other than the depressing personal reality that male college dropouts on average will have higher lifetimes earnings that female PhDs, the tool is very useful and helps students visualize the idea of going in to debt before climbing higher than those who have no student loans.
You can access the tool here: http://static.fusion.net/lifetime_earnings/
The online tool uses data from PayScale to show the median lifetime earnings for people based on their gender, level of education, degree type, and gender. If you want more information about the data, click on the Methodology link on the lower left hand corner or the Analysis section on the menu bar located across the top of the screen. If you would like to see some examples, check out the "Featured Charts" on the same menu bar.

Some of my thoughts on this
You can access the tool here: http://static.fusion.net/lifetime_earnings/
The online tool uses data from PayScale to show the median lifetime earnings for people based on their gender, level of education, degree type, and gender. If you want more information about the data, click on the Methodology link on the lower left hand corner or the Analysis section on the menu bar located across the top of the screen. If you would like to see some examples, check out the "Featured Charts" on the same menu bar.
Some of my thoughts on this
- Figuring out how to add new people to the chart was a bit confusing at first, but I eventually got the hang of it. Don't get discouraged.
- It would have been great to also see Race/Ethnicity on here. I didn't really see any mention of why it was not there -perhaps it is not something that PayScale collects?
- I had some questions on using past data to predict future outcomes. Fusion Senior editor Felix Salmon gave his take on that in the NPR Interview (Listen Here). I'm not sure if I agree but this would be a great discussion point for more advanced methods courses.
- Despite all of that, I think this is a great visualization and I hope it will get students talking about the cost of education.s
Monday, September 1, 2014
Gender Testing of Athletes Activity [Interactive Graphic]
On this website, students can click through an exercise in "determining" an athlete's gender/sex. This is a useful activity for helping students complicate their understandings of gender and sex. It would also help begin a conversation about gender and sports.
The website states:
"Do you think that determining an individual's gender should be straightforward? Can you think of a single test or examination that can unambiguously identify a person's gender? What happens if various tests disagree?
"Try this interactive exploration that challenges you to determine whether an athlete is qualified to compete as a female. Along the way you may gain some understanding of the biology of sex and in particular how sex is determined in humans."
I assign this activity as homework and have students discuss in the next class how the activity illustrates the social construction of gender and sex categories. In conjunction with this activity, I provide examples of the media coverage of athletes who have had to undergo this type of testing. I also discuss the concept of “determining gender” from the article “Doing Gender, Determining Gender: Transgender People, Gender Panics, and the Maintenance of the Sex/Gender/Sexuality System” by Westbrook and Schilt (2014).
Link to activity: http://www.hhmi.org/biointeractive/gender-testing-athletes
Subscribe to:
Posts (Atom)